Bar Replay: how and why to test a strategy in the past
Bar Replay enables users to simulate past price movements for strategy testing. This tool assists traders in refining strategies by analyzing historical market behavior and practicing trading decisions without real financial exposure. It offers a risk-free, interactive, and dynamic way to enhance your trading skills, refine strategies, and gain valuable insights into historical market behavior.
CONTENTS:
Why you need Bar Replay
Historical trading starts at a selected point with adjustable replay speed that enables you to observe strategy performance. But, Bar Replay isn't just about exploring the past, it can help you think ahead for the future. Here are some of the key benefits of Bar Replay.
Strategy refinement: Use historical price analysis and simulated trading to test and refine trading strategies, identifying improvement opportunities.
Realistic learning: Experience simulated real market conditions and gain practical insights into how strategies perform.
Historical insights: Study past price movements to uncover patterns and trends that inform trading decisions.
Risk-free practice: Develop trading confidence and experience through practice without real financial exposure.
Variable speed: Control replay speed to effectively learn tools and strategies.
Using Bar Replay
Mastering new features takes time. Here is a quick how-to guide to get you started.
Open Bar Replay: First, find the "Bar Replay" button on your chart's top panel — it looks like a video rewind button.

Navigate playback: Inside the replay panel, you'll find playback buttons similar to media player controls. Experiment with these buttons to learn their navigation features.
Select starting point: You can now choose a starting point for your replay on the chart. When you hover your cursor over the chart screen, a blue vertical line with scissors appears. Click on your desired starting date and time.
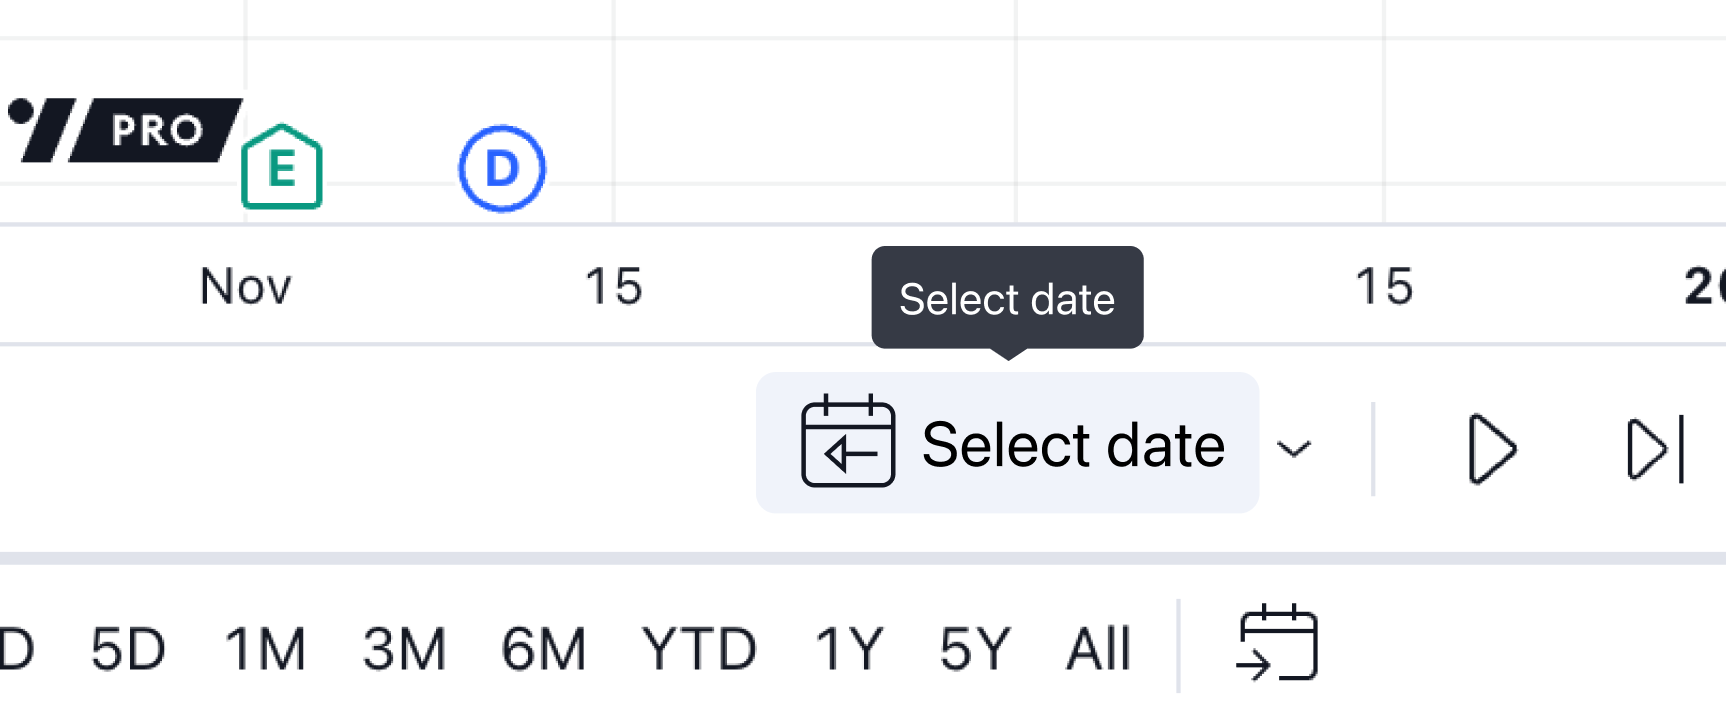
Here, you can select specific dates to make any bar in the chart's history your replay starting point. Alternatively, you can choose the "Select the first available day" button to start from the chart's earliest date.
You can also choose the "Random bar" function, which will take you to a random bar within the chart.

Start the playback: Click the "Play" button to begin the replay. You can adjust the replay speed before or during playback according to your preferences.

Manual advancement: Slow down the replay to catch all the details. To move forward one step at a time, simply click the "Forward" button.

Monitor status: You can check the chart's status display to see when Bar Replay is active. The replay symbol indicates the chart is in replay mode. Without replaying, this symbol won't be visible.

Change starting point: You can switch to a different starting point even during replay. Choose from "Select bar," "Select data," or "Random bar" to establish a new starting point for your analysis.
Multiple charts: You can simultaneously run Bar Replay on all charts in the layout and track dynamic changes in one or multiple different symbols across various timeframes at the same point in time.
When accessing a workspace with several charts, you can choose a replay mode: either one current chart or all charts.
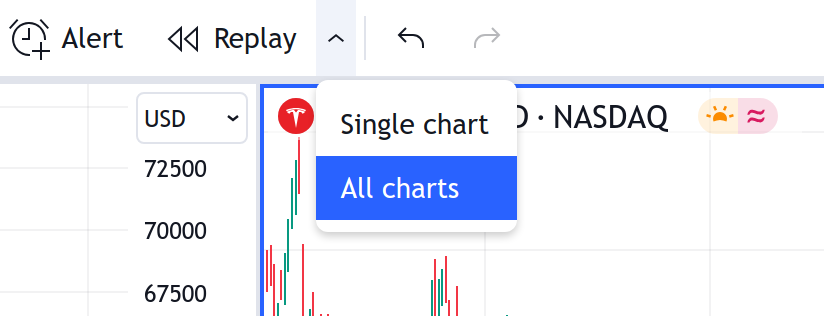
In single chart mode, you can launch the replay on only one chart, and it will function the same as before.
When you select the starting bar in "All charts" mode, the starting line will appear on all charts in the layout. While you choose the starting point on one chart, the charts are synchronized in time so that the replay starting point on each chart is visible.

Replay synchronizes in time, so charts with different intervals work together — charts with larger intervals wait for data from charts with smaller intervals. For example, a weekly chart won't show a new bar until seven bars have loaded on a daily chart.
End the replay: You can stop the replay and return to live data using the "Jump to real-time chart" button. This instantly brings you back to current market conditions.

Close the replay panel: You can close the replay panel by clicking the "X" button or by clicking the "Bar Replay" button again.
Using drawings and indicators
Drawings and indicators function somewhat differently in Bar Replay compared to regular charts in terms of purpose and functionality.
In Bar Replay, drawings serve as annotations for historical price data, helping with strategy testing. You can create drawings, and they will be saved after you close Bar Replay.
Indicators offer insights into past price movements based on selected parameters, allowing you to evaluate indicator performance for strategy improvement. In Bar Replay, indicators can process replayed data for calculations.
With Bar Replay, you can access all available data, whether it's 1-hour, 1-minute, or even 1-second intervals. You'll get access to the maximum depth of data history and can play it in Replay mode as far back as the symbol's data is available on TradingView.
The amount of historical data varies depending on the selected symbol and chart interval. Intraday intervals show a limited amount of data. As a result, intraday interval data may be shorter than daily data.
For example, if you replay Apple stocks on a daily interval, the daily history starts from December 12, 1980, while 1-minute AAPL data starts from January 3, 2000, and the earliest 1-second bar in replay dates from August 17, 2022.
For some symbols, we have 1-minute data dating back to 2011, for others back to 2009, while some extend even further to 2000. So, you can replay up to 20+ years of minute data in replay mode. At the same time, other symbols have shorter intraday history, therefore less data is available in replay.
For all second-based timeframes, TradingView stores data starting from August 2022, and the earliest second-bar in Replay dates from August 17, 2022.
| Symbol | Initial 1-second bar | Initial 1-minute bar | Initial daily bar |
| NASDAQ:AAPL | August 17, 2022 | January 3, 2000 | December 12, 1980 |
| NASDAQ:MSFT | August 17, 2022 | January 3, 2000 | March 13, 1986 |
| SP:SPX | August 17, 2022 | January 3, 2000 | January 1, 1871 |
| TVC:VIX | August 17, 2022 | April 8, 1997 | January 3, 1990 |
| TVC:DXY | August 17, 2022 | March 13, 2007 | January 31, 1967 |
| FX:EURUSD FX:GBPUSD | August 17, 2022 | November 28, 2001 | January 4, 1971 |
| BITSTAMP:BTCUSD | August 17, 2022 | August 18, 2011 | August 18, 2011 |
| BITSTAMP:ETHUSD | August 17, 2022 | August 7, 2015 | August 7, 2015 |
The above-mentioned replay limits do not apply to continuous futures charts — 1! and 2! symbols (for example, ES1!, BANKNIFTY1!), and to futures contracts with the enabled "Use settlement as close on daily interval" setting, as they have their own special intraday limitations due to their synthetic nature
To find out where the initial replayable bar for a certain symbol is, simply turn on Replay mode, choose "Select date…" in the dropdown at the replay panel, and then press "Select the first available day."

Therefore, you can initiate the replay from the very first bar or any other bar within the available history from the "Select date" menu.To access more detailed intraday data, you can select the starting point for Bar Replay on a higher interval and then switch to a lower interval.
For example, to replay older 1-minute bars, you can go to the daily interval, enable Replay mode, choose the "Select bar" option, and manually select the starting point on the chart. Then, switch to a 1-minute interval and press "Play."

If the specified starting point for the replay is too distant and no data is available for the selected time period, Bar Replay will automatically jump to the first available bar.

When you switch timeframes from higher to lower ones, it may happen that data is available on the higher timeframe (e.g., 1 day) but not on the lower timeframe chart (e.g., 1 min) because the intraday plan's limit has been reached or there is no intraday data in our data storage this far back in time. In this case, you will see the message "Data point unavailable" in the bottom left corner of the chart, and your timeframe remains unchanged.
If you want to use a lower timeframe in Replay anyway, you need to choose a starting point where lower timeframe data is available by using the "Select date" option → "Select the first available day."

Hotkeys
Moving efficiently is important. Hotkeys can be used in Bar Replay to help you quickly and conveniently control playback from the keyboard, without using a mouse or trackpad.
To begin or halt playback, simply press "Shift + ↓."
To advance one step forward, just press "Shift + →."
Extra tips
As you're getting to know Bar Play better, you'll find out how it works in practice. Before you start practising, here are a few helpful hints:
- Server-side alerts persist based on real-time data
- Generating new server-side alerts is not possible during replay
- Trading orders are executed using real-time data, including those in Paper Trading and with other brokers
- Quotes visible on the trading panel and in the quotes list align with real-time data while in replay mode
- Regression trend and fixed range volume profile are inactive during replay
- It's not possible to replay bars in smaller segments
- The following chart types don't work with Bar Replay — Heikin Ashi, Renko, Line break, Kagi, point and figure, range
- Bar Replay does not work with spread charts and tick-based charts
Bar Replay in a nutshell
Bar Replay is a powerful TradingView feature that allows you to simulate historical market conditions for strategy testing and skill development.
You can select any starting point from available historical data (ranging from decades of daily data to recent second-by-second data) and replay market movements at customizable speeds.
The tool supports multiple chart synchronization, works with drawings and indicators, and provides risk-free practice opportunities.
Also read: