Notice!
This is documentation for v4, which is no longer
actively maintained.
For up-to-date documentation, see the latest version.
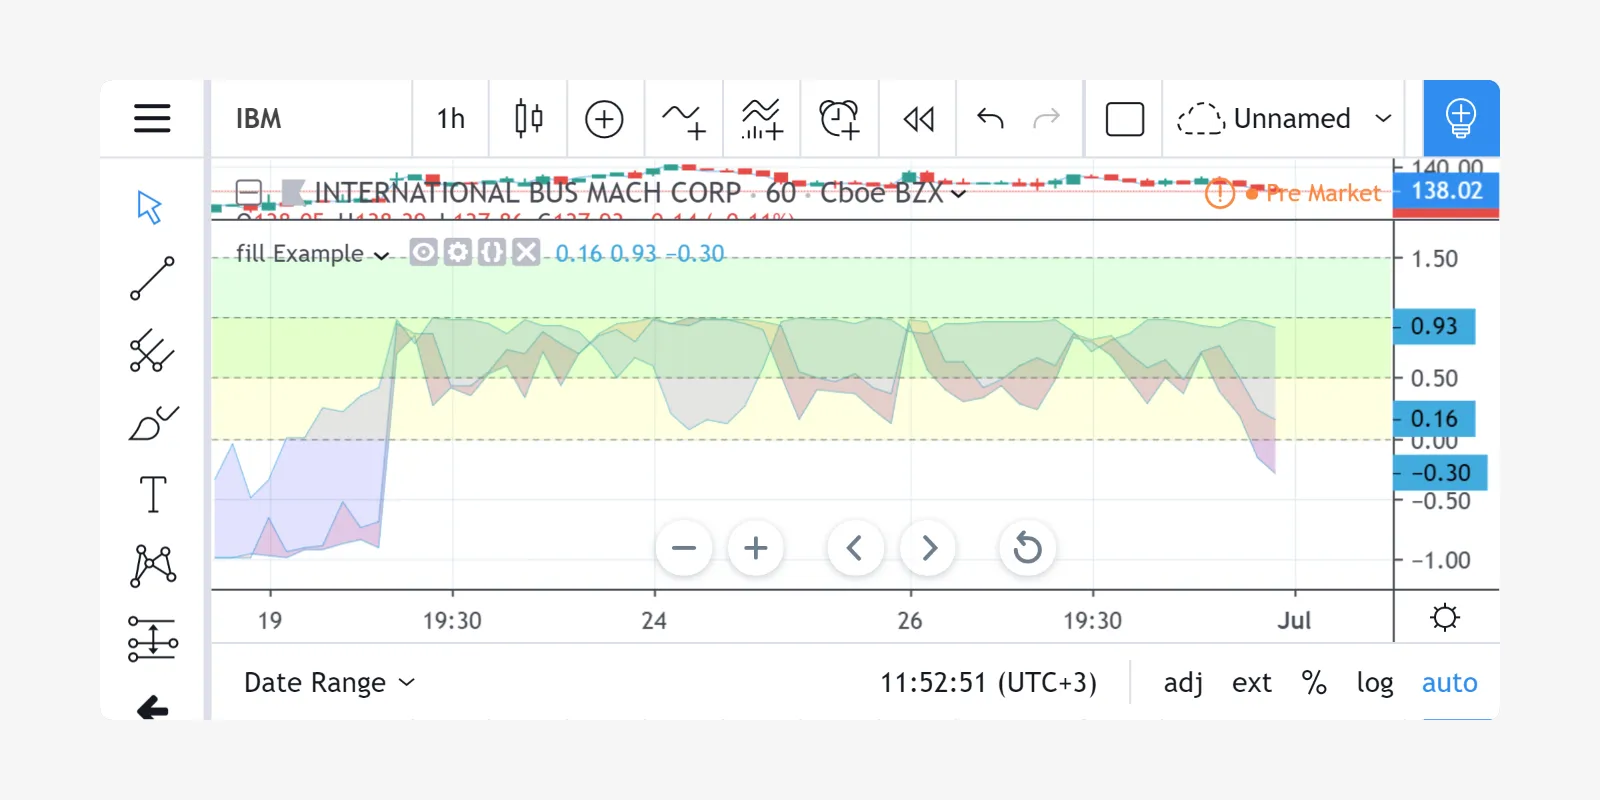
Filling the background with fill
The
fill
annotation function lets you color the background between two plotted
series or two horizontal lines created with hline. The following
example illustrates how fill works:
//@version=4
study("fill Example")
p1 = plot(sin(high))
p2 = plot(cos(low))
p3 = plot(sin(close))
fill(p1, p3, color=color.red)
fill(p2, p3, color=color.blue)
h1 = hline(0)
h2 = hline(1.0)
h3 = hline(0.5)
h4 = hline(1.5)
fill(h1, h2, color=color.yellow)
fill(h3, h4, color=color.lime)
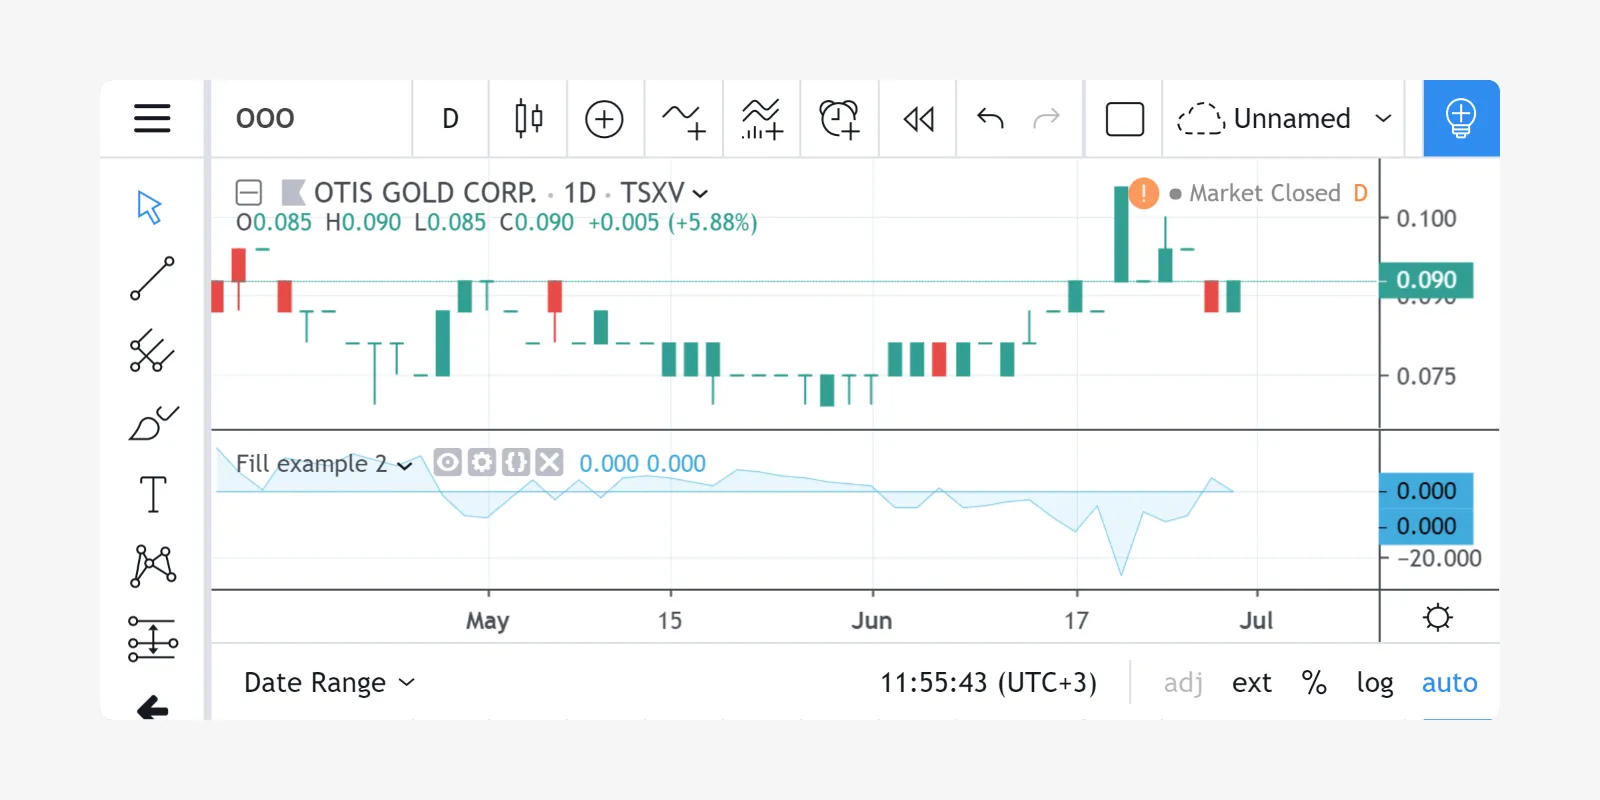
Please note that the fill annotation cannot be used with plot and
hline arguments simultaneously. As a workaround you may replace
hline calls with a plot(<constant number>). For example:
//@version=4
study("Fill example 2")
src = close, len = 10
ma = sma(src, len)
osc = 100 * (ma - src) / ma
p = plot(osc)
// NOTE: fill(p, hline(0)) wouldn't work, instead use this:
fill(p, plot(0))
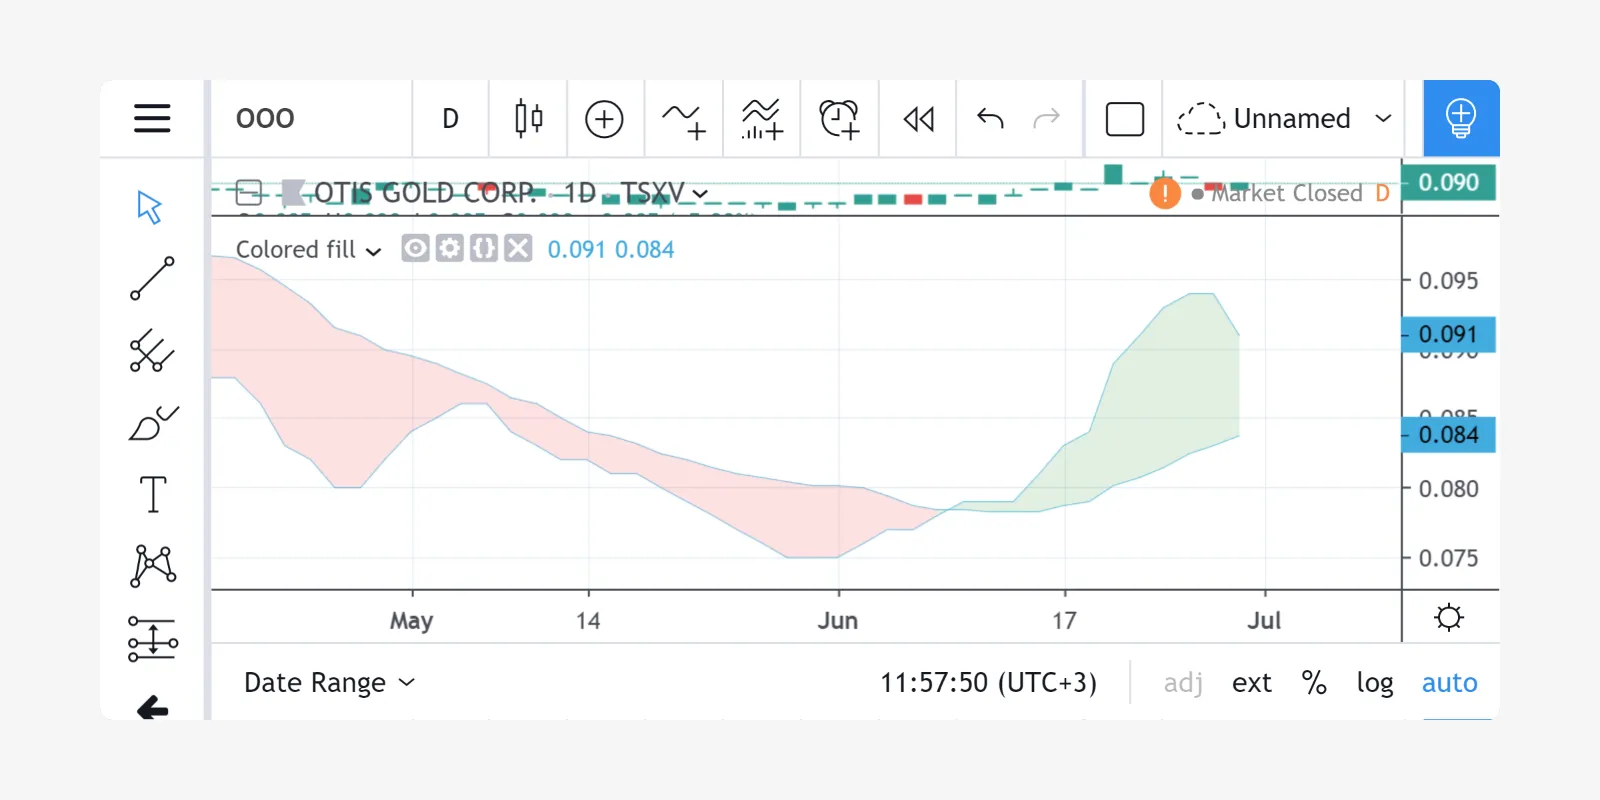
You can set the fill color by using constants like color=color.red or
color=#ff001a, as well as complex expressions like
color = close >= open ? color.green : color.red. Example:
//@version=4
study(title="Colored fill")
line1=sma(close, 5)
line2=sma(close, 20)
p1 = plot(line1)
p2 = plot(line2)
fill(p1, p2, color = line1 > line2 ? color.green : color.red)